Note 1: please wait a moment until the website loads completely.
Note 2: please do not run other functions when your module is in process.
OR
Note: please do not select one row in the following table when searching.
Userful tool for SNP function:
Userful Links:
UK Biobank https://www.ukbiobank.ac.uk/
GWAS catalog http://www.ebi.ac.uk/gwas/
Ensembl http://asia.ensembl.org/index.html
GENCODE https://www.gencodegenes.org/
Association between genetic variants and Overall and Cancer-specific Survival
DownloadNote: please wait 1~2 minutes when plotting.
Download Plot
Note: please do not select one row in the following table when searching.
Userful Links:
IEU GWAS database https://gwas.mrcieu.ac.uk/
TwoSampleMR website https://mrcieu.github.io/TwoSampleMR/
Association between risk factors and Overall and Cancer-specific Survival
DownloadNote: please wait 1~2 minutes when plotting.
Note: please do not select one row in the following table when searching.
Userful tool for Gene function:
Userful Links:
eQTLGen Consortium database https://eqtlgen.org/
SMR website https://yanglab.westlake.edu.cn/software/smr/#Overview/
Association between biomarkers and Overall and Cancer-specific Survival
DownloadNote: please wait 1~2 minutes when plotting.
If you input your email address, you also can receive results by email.
Association between your data and Overall and Cancer-specific Survival
DownloadNote: please wait 1~2 minutes when plotting.
Download Plot
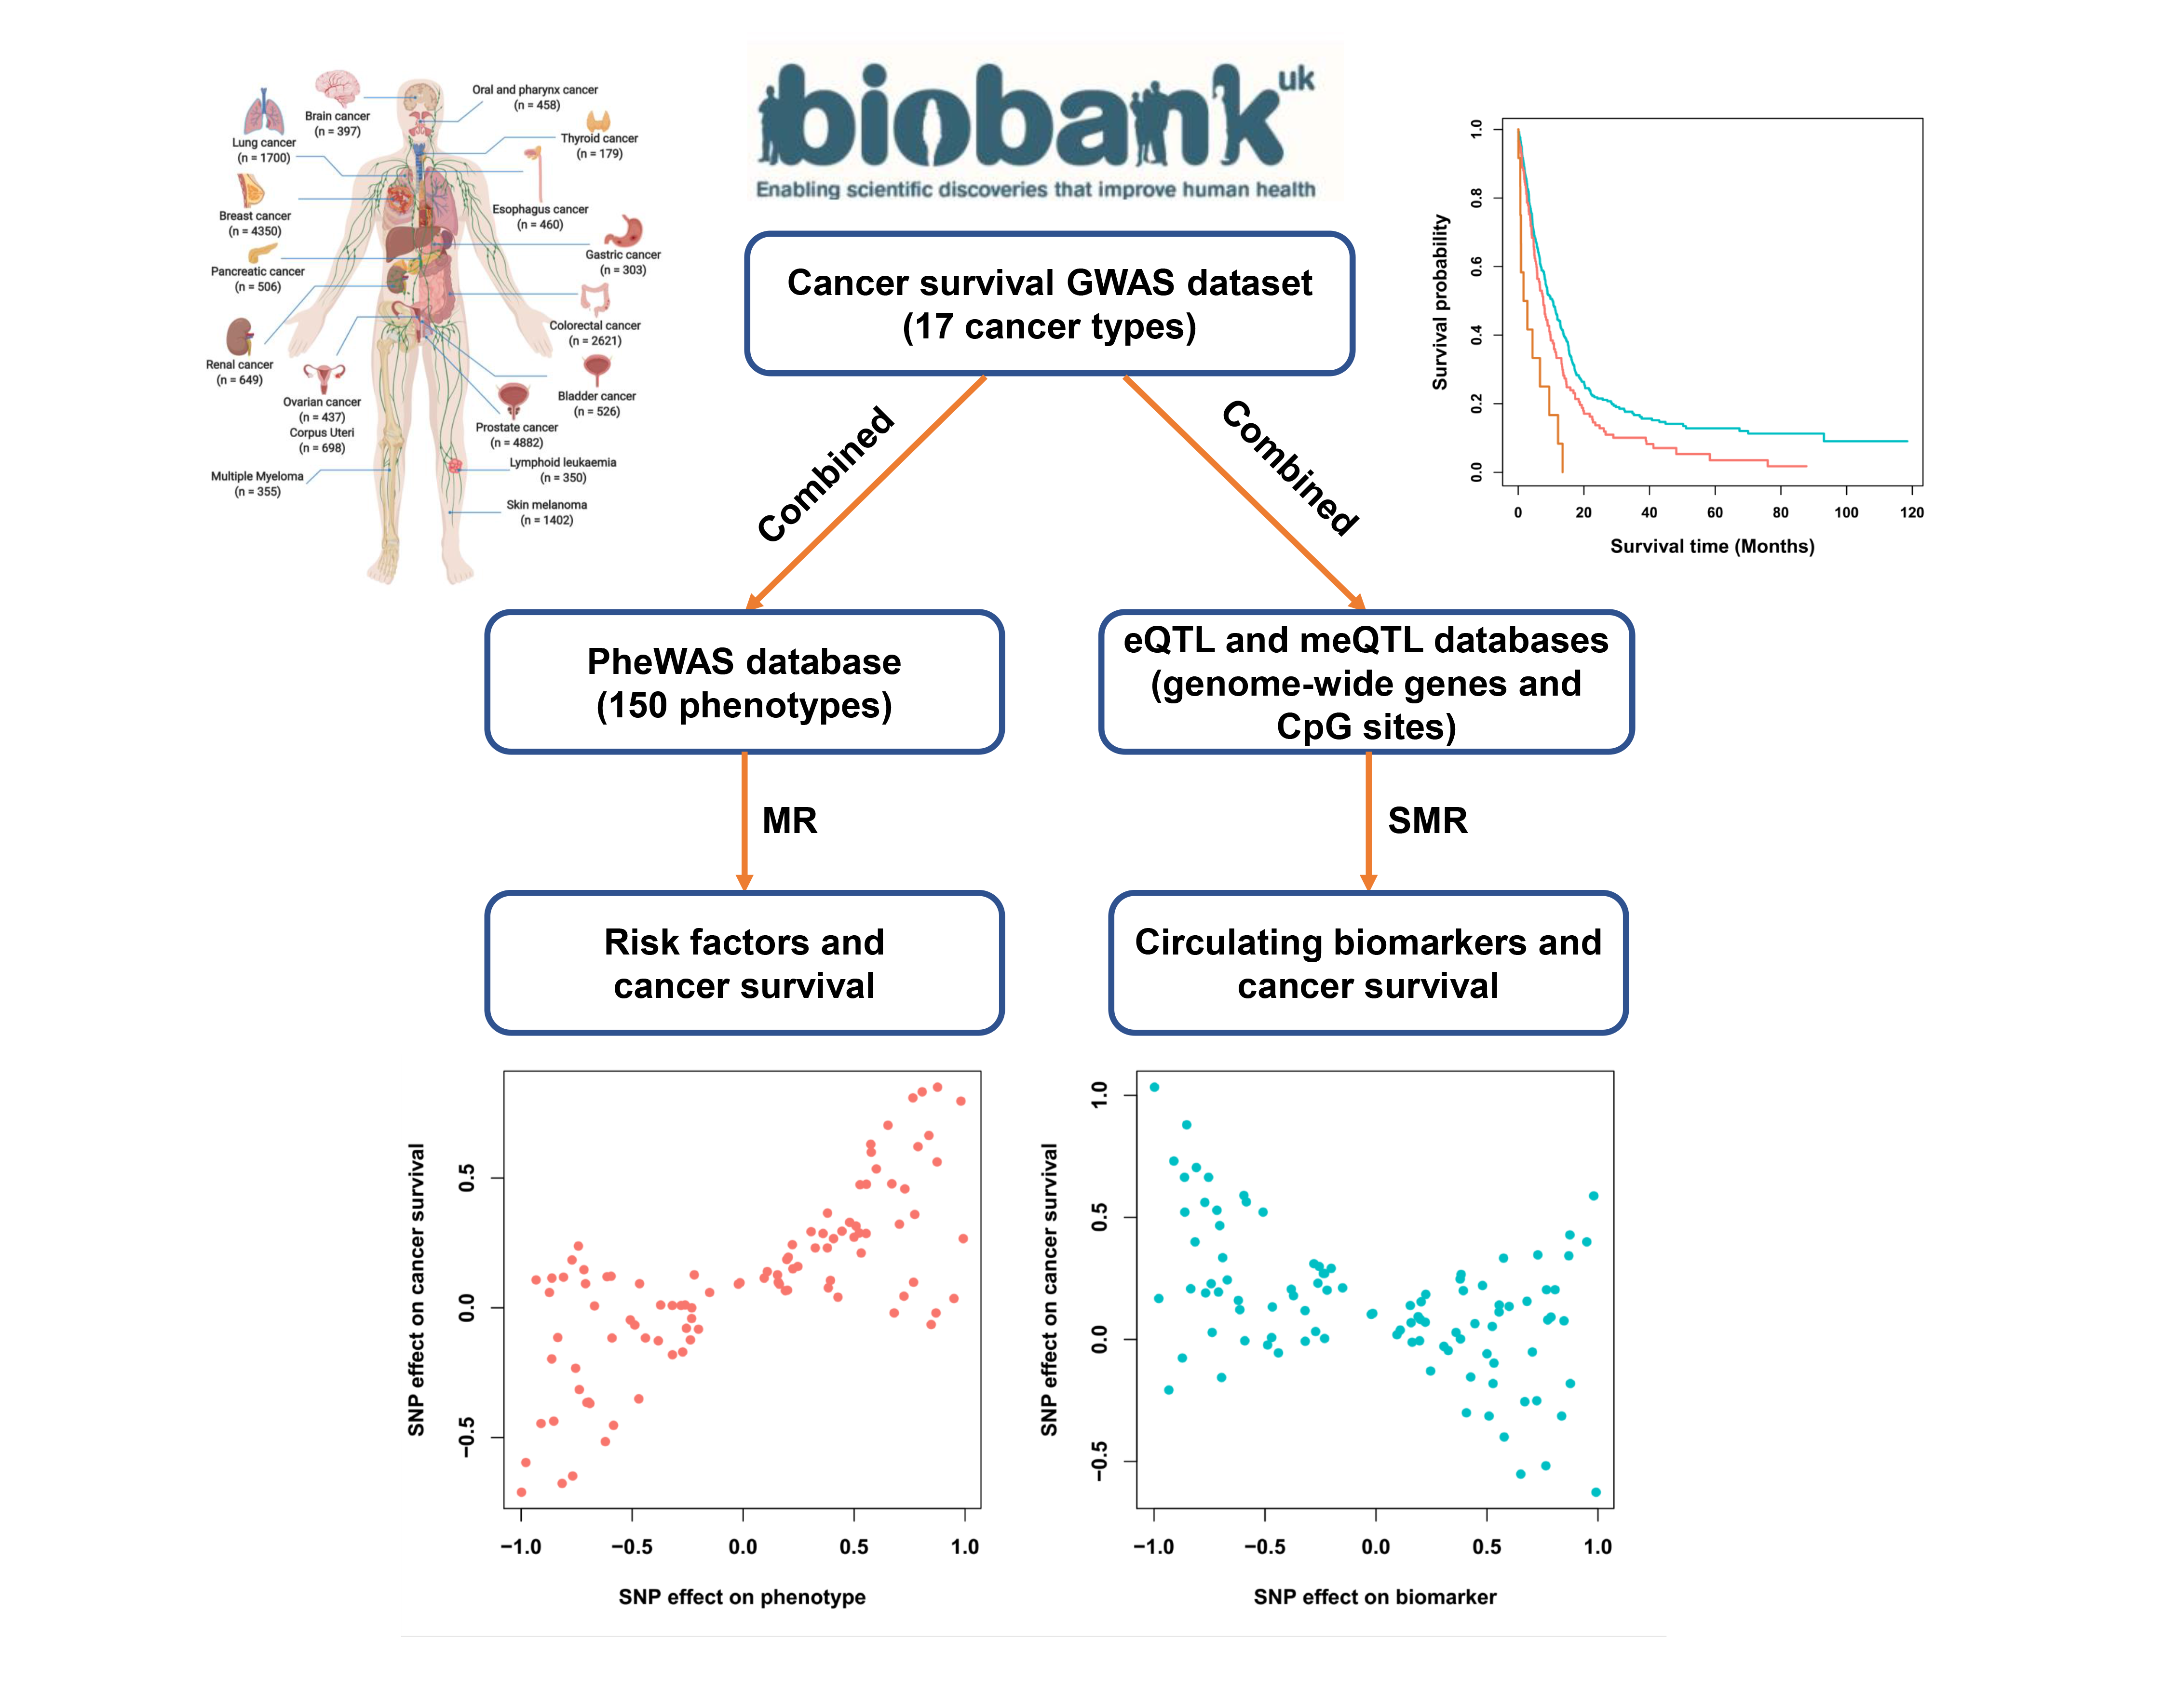
SUMMER database aims to systematically evaluate the effects of risk factors and circulating biomarkers on pan-cancer survival using Mendelian randomization (MR) analysis.
Introduction:
Until now, genome-wide association study (GWAS) has identified hundreds of genetic loci linked to cancer susceptibility; however, the genetic architecture of cancer survival, which are fundamental for patients, has not been widely established. Here, we systematically evaluated the effects of genetic variants on cancer survival (i.e., overall survival and cancer-specific survival), leveraging genotyping and clinical data from 19,656 incident patients across 17 cancer types deposited in the UK Biobank cohort. Furthermore, to assess the causal effect of risk factors and circulating biomarkers on the prognosis of cancer patients, we performed a comprehensive Mendelian randomization (MR) analysis by integrating cancer survival GWAS dataset with phenotype-wide association study (PheWAS), blood genome-wide expression quantitative trait locus (eQTL) and methylation quantitative trait loci (meQTL) datasets.
In SUMMER database, users can:
a. Browse and download the associations of genome-wide single-nucleotide polymorphisms (SNPs) with cancer survival:
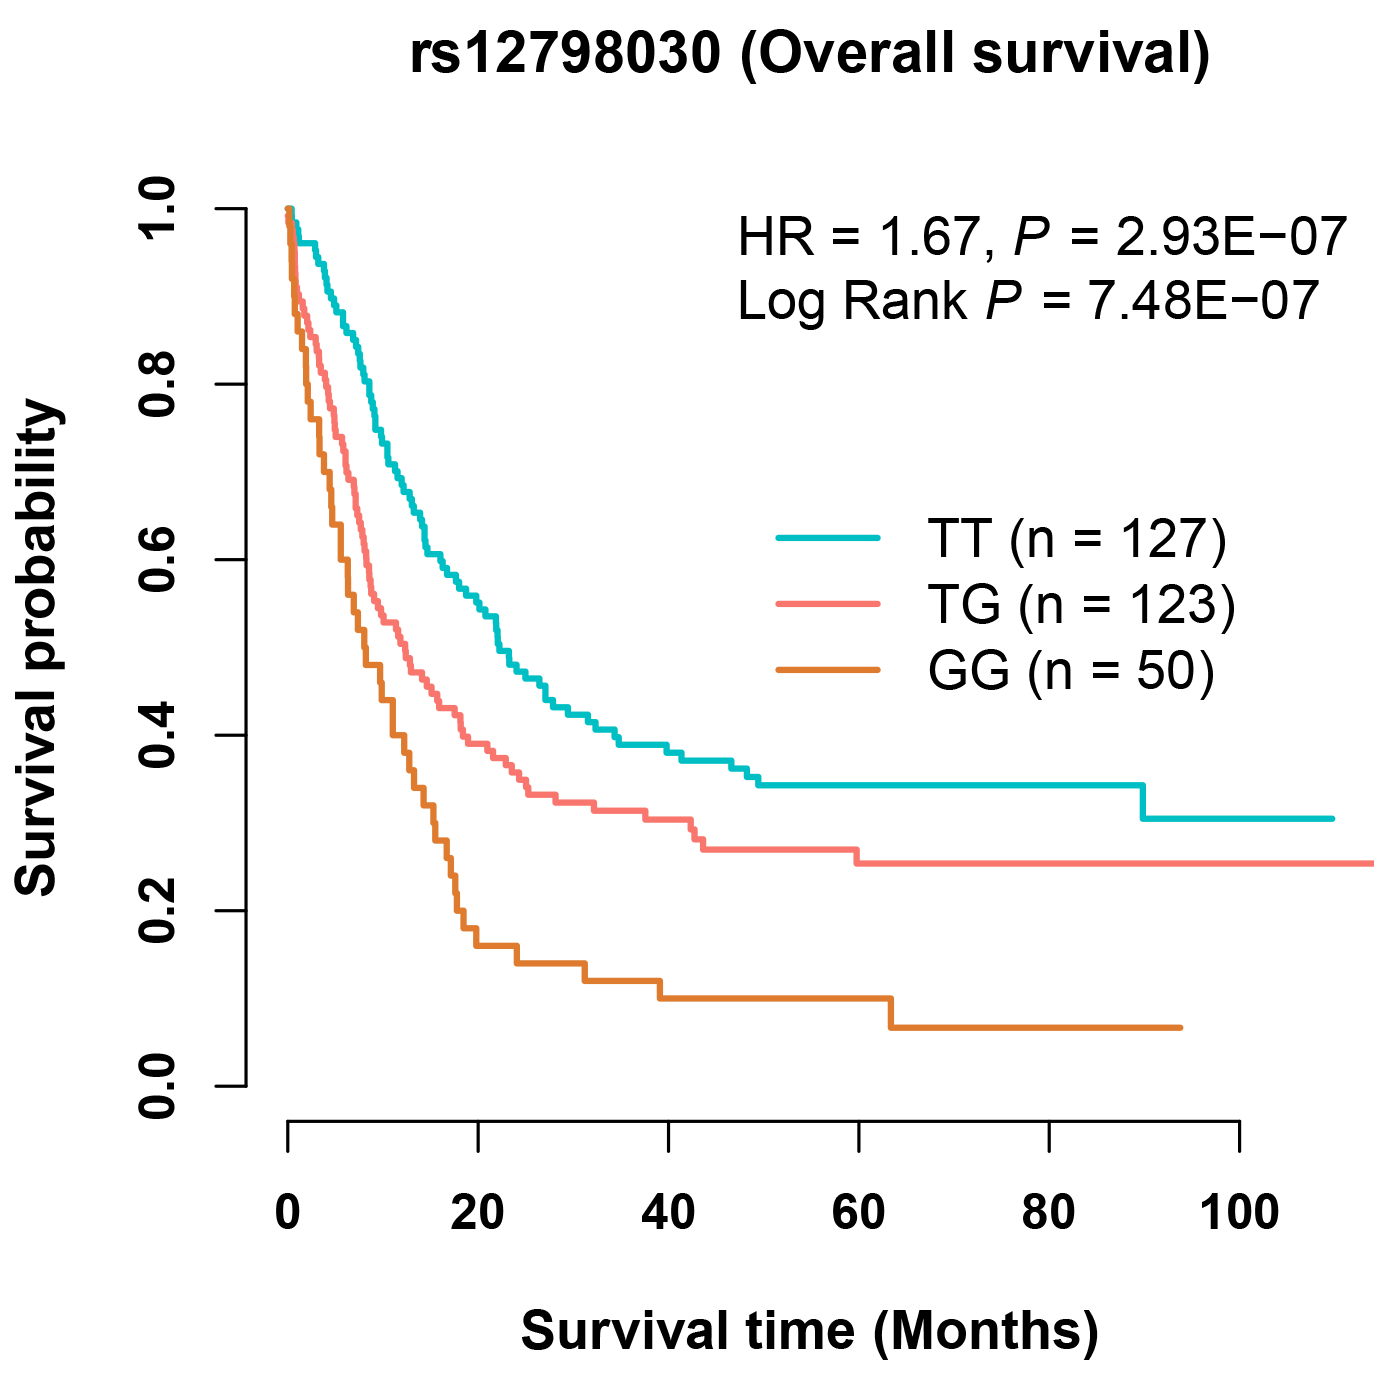
When users select a cancer type and enter a batch of SNP IDs, or enter a genetic region, a table will be built to display the associations of SNPs with cancer survival (i.e., overall survival (OS) and cancer-specific survival (CSS)). Users can download the results for each cancer type by clicking the 'Download' button. Besides, users can select one SNP-survival pair and click the 'Plot' button, and the diagrams of KM plot will be provided to display the associations. Users can also enter a SNP ID to search its potential functions in the Functional exploration part. For example, gastric cancer patients with the SNP rs12798030 TG or GG genotypes have shorter OS time than patients with rs12798030 TT genotype (HR = 1.67, P = 2.93E-07; P for log-rank test = 7.48E-07).
Note: The survival results with low statistical power (e.g., Thyroid cancer) should be used with caution.
b. Browse and download the associations of multiple phenotypes with cancer survival:
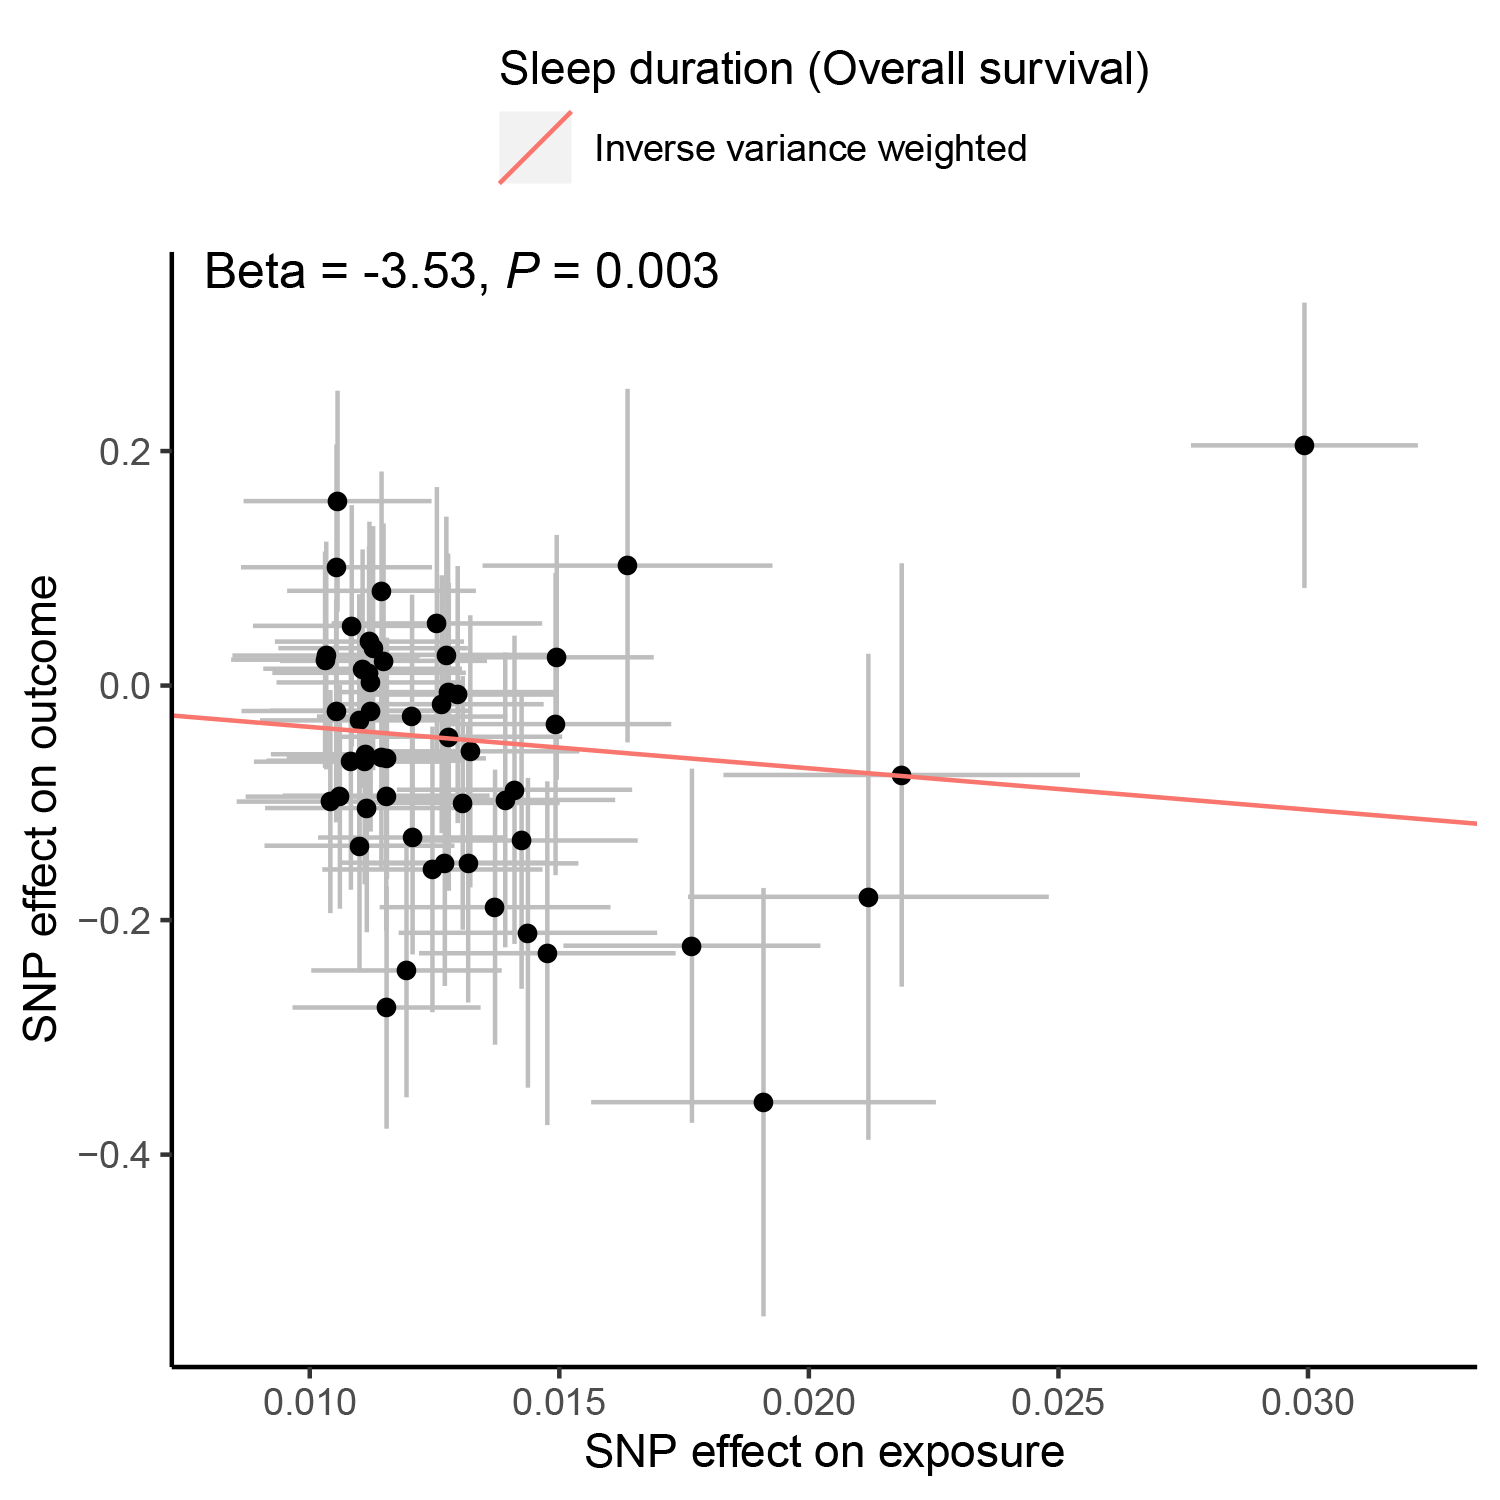
When users select a cancer type, a phenotype type (e.g., Anthropometric, Autoimmune/inflammatory or Behavioural) and survival type (e.g., OS or CSS), a table will be built to display the associations of related phenotypes with cancer survival. Users can download the results for each cancer type by clicking the 'Download' button. Besides, users can select one phenotype-survival pair and click the 'Plot' button, and the diagrams of scatter plot will be provided to display the associations. For example, sleep duration was associated with an improved OS of gastric cancer (betaIVW = -3.53, PIVW = 0.003, Pegger intercept = 0.411, PIVW heterogeneity = 0.798).
c. Browse and download the associations of multiple circulating biomarkers with cancer survival:
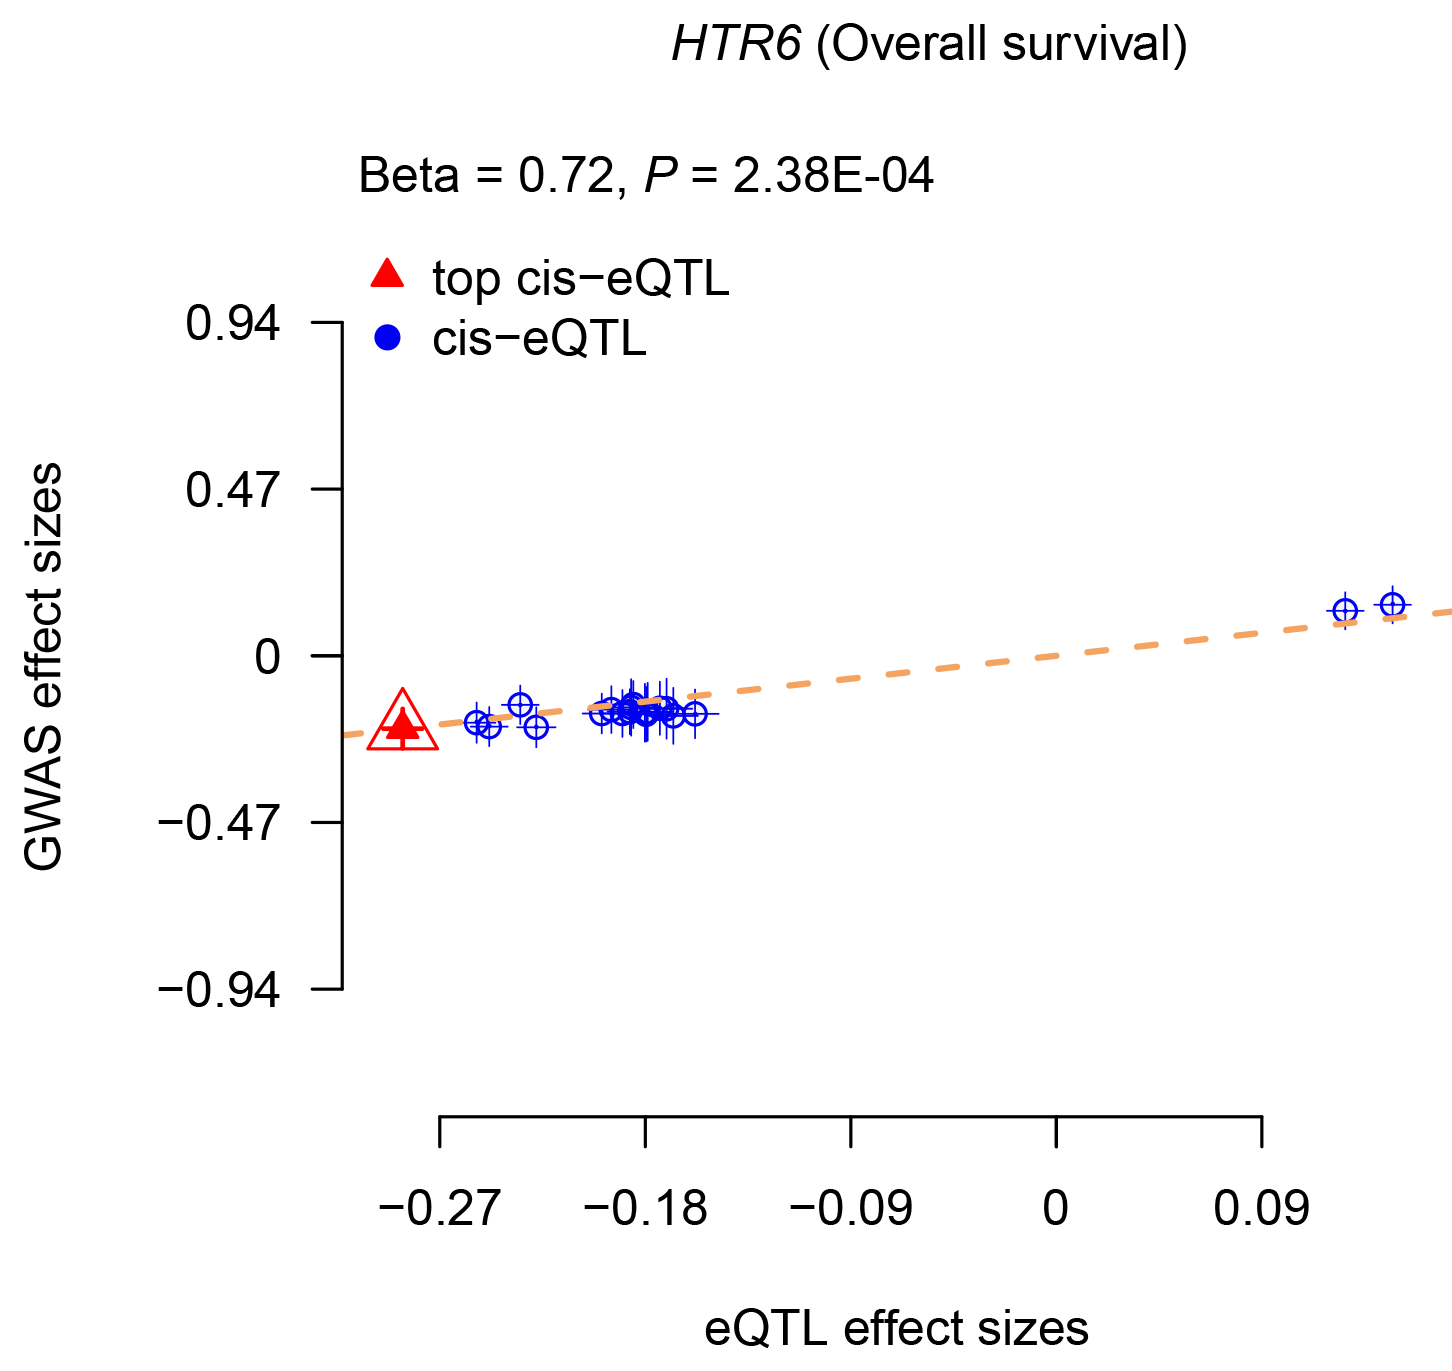
When users select a cancer type, a biomarker type (e.g., gene expression or CpG site) and survival type (e.g., OS or CSS), a table will be built to display the associations of related biomarkers with cancer survival. Users can download the results for each cancer type by clicking the 'Download' button. Besides, users can select one biomarker-survival pair and click the 'Plot' button, and the diagrams of scatter plot will be provided to display the associations. Users can also enter a gene name to search its potential functions in the Functional exploration part. For example, higher expression of HTR6 was associated with a poorer OS of colorectal cancer (betaSMR = 0.72, PSMR = 2.38E-04, Pmulti-SMR = 0.007, PHEIDI = 0.692).